LiquidationsFirst, thanks to the following Tradingview community members for providing open source indicators that I used to develop this indicator!
Liquidations by volume (spot/futures) - @Thomas_Davison
Pivot and liquidation lines - @lmatl
Let me know if either of you do not approve and I will remove the indicator.
This indicator uses pivot points, volume and a liquidation percentage to determine potential liquidation levels. These are not exact but can give traders an idea of potential support or resistance levels.
Pivot points: Currently the pivot points are set to look left 5 bars and right 2 bars. This will determine the high and lows in the chart.
Volume: Assuming that high volume bars are where more leverage is used, this indicator uses the average volume over a 1000 bar period to determine to determine a baseline. I have arbitrarily set 100x lines to 20% above the average volume, 50x lines 10% above, 25x lines 5% above, 10x lines 2.5% above and 5x lines 1.25% above.
Liquidation: Finally, we are making a few assumptions on how liquidations are calculated. The following table includes the percentage a position can decline before being liquidated.
Short: Long:
100x 0.51% 0.49%
50x 1.55% 1.47%
25x 3.70% 3.38%
10x 5.11% 4.67%
5x 6.705% 6.115%
Let me know if there are any questions or if anyone has any improvements!
Pesquisar nos scripts por "pivot points"

Zig Lines with Percent & ValueOverview, Features, and Usage:
The Zig Lines with Percent & Value is an indicator that highlights the highest and lowest points of the market from pivot points and zigzag lines based on the ZigZag Period setting. By a default value of 13 for the ZigZag Period this works well on Bitcoin or other alt coins on the 1 hour or higher timeframe charts.
What makes this indicator unique is that it draws a green line to signify an uptrend or a red line to signify a down trend. It will also show the percent difference between the previous point/line, for example: If you see a -negative percentage point with a red line drawn to it, then you are looking at a low pivot point and then as the green line is drawn to a +positive percentage value the percentage you see is the difference between the two points. This is great to see a trend reversal as you can look at previous pivot points and notice about how far the price moves before it changes direction (trend reversal).
There is an invisible EMA line that is used to assist with coloring the negative vs positive values. The value above or below the percentage is the lowest or highest price at that pivot point . The display of the price at the pivot point depends on your ZigZag Period setting and the timeframe of your chart.
Added Bollinger Bands as it fits perfectly with the visuals of the Zig Lines & Pivots.
Usage of Bollinger Bands:
~As the price or candle gets close to the top or bottom of the Bollinger band it can give you a better confirmation that the pivot location is at it's final place, and the trend is more likely to switch directions.
It’s important to know this indicator should not be used for alerts of any type it does repaint as the green or red line is drawing based on live chart data and it can change depending on the direction of the market. This is a great visual tool for trend analysis or to be used with other indicators as a confirmation for a possible good entry or exit position.
Credits ( and consent to use ):
Credits go to user LonesomeTheBlue for creation of this 'Double Zig Zag with HHLL' script.
The addition of the Value above/below the Percentages is from user Noldo and that script is found here:
The Bollinger Bands setup was suggested by user countseven12 and his script that uses the same BB setup is found here:
References:
1. Chen, James. (2021 March 15). Zig Zag Indicator . Received from http: www.investopedia.com
2. Mitchell, Cory. (2021 April 30). Pivot Points . Received from http: www.investopedia.com

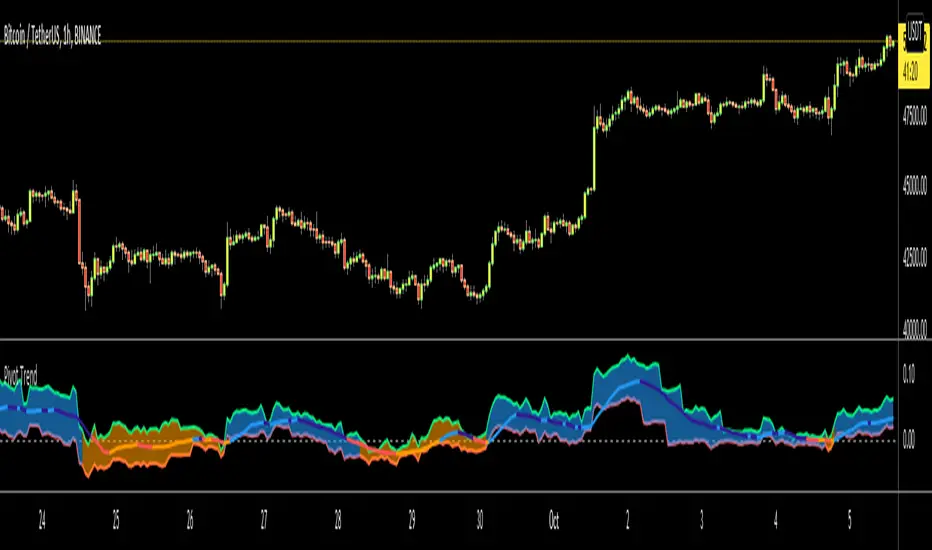
Pivot TrendHello Traders,
Another original idea is here with you. Actualy I can say that it's a breakout strategy that uses multiple Pivot Point's averages.
How it works?
- it finds the Pivot Points, you can set the length as you want
- it gets averages of Pivot Highs and Pivot Lows, you can set the number of Pivot Points to be included
- it compares the current closing price with averages of Pivot Highs and Pivot Lows
- if both are positive or negative then trend changes
You have two options:
- Pivot Point Period => is the length that is used to find Pivot Points. means it checks left/right bars if it's Pivot Point (4 by default)
- Number of PP to check => is the number of Pivot Points that the script finds and calculates the averages (3 by default)
An Example with the settings Pivot Point Period = 5 and Number of PP to check = 2
Play with settings as you wish. Comments are welcome, together we can improve it ;)
Enjoy!
Market Structure [odnac]Overview
This indicator is a comprehensive tool designed for traders utilizing Smart Money Concepts (SMC) and Price Action. It automatically identifies and labels significant market structure shifts, specifically BOS (Break of Structure) and CHoCH (Change of Character), helping you stay on the right side of the trend.
Key Features
Dual Logic Modes (V1 & V2):
V1 (Fixed Pivot): Only utilizes confirmed pivot points. Ideal for conservative traders looking for major swing levels.
V2 (Dynamic Update): Automatically updates swing points to the actual highest high or lowest low between breaks. This provides a more fluid and accurate representation of price flow.
Smart Confirmation: Unlike basic pivot scripts, this indicator uses a multi-bar confirmation logic (checking candle polarity and close sequences) to filter out market noise and false pivots.
Automatic Trend Detection: The indicator tracks the current market bias (Bullish/Bearish) and visualizes it through customizable background colors or shapes.
Clear Visual Cues: * BOS: Indicates a continuation of the current trend.
CHoCH: Signals a potential trend reversal.
How to Use
Identify Trend Direction: Use the background coloring or the shapes at the bottom to quickly identify if the market is in a Bullish (Green) or Bearish (Red) phase.
Look for Structure Breaks: * When price breaks a previous high/low, the indicator will draw a line and label it as BOS if the trend continues, or CHoCH if the trend flips.
Customize for Your Assets: * For volatile assets like XLM or other cryptocurrencies, you can adjust the Swing Left/Right Bars inputs to filter for either micro-structures or macro-trends.
Input Settings
Version: Choose between V1 (Strict Pivots) and V2 (Dynamic Ranges).
Swing Left/Right Bars: Determines the sensitivity of high/low detection. Increase these values to find "stronger" structural points.
Trend Visualization: Toggle between Background fills, Shape markers at the bottom, or None for a cleaner look.
Show Swings: Toggle the visibility of the white circles marking confirmed pivot points.
Disclaimer
Market structure is a lagging indicator by nature as it requires confirmation. Always use this tool in conjunction with other technical analysis methods (Order Blocks, Fair Value Gaps, or Volume) for the best results.

HL/LH Confirmation Strategy (Clean Market Structure)🚦 HL/LH Confirmation Strategy (Clean Market Structure)
This indicator is specifically designed to help traders identify a clean market structure by tracking the formation of Higher Lows (HL) and Lower Highs (LH). Rather than chasing new price extremes (new Highs or new Lows), the focus is on waiting for trend strength confirmation before considering an entry.
Key Strategy: Waiting for Trend Confirmation 💡
The core advantage of this indicator lies in its confirmation strategy:
For Uptrends (Bullish): The indicator doesn't signal just any low, but only when it detects a Higher Low (HL)—a low that is higher than the previous low. This is a crucial sign that the market has defended a level and is ready to continue moving up. This approach helps avoid chasing new lows and encourages entering trades after confirmation.
For Downtrends (Bearish): Similarly, the indicator looks for the formation of a Lower High (LH)—a high that is lower than the previous high. This suggests that buyers failed to breach the last resistance, signaling a potential continuation of the downside movement.
The indicator alternates between looking for an HL, then an LH, then an HL, visually mapping the Pivot swings and highlighting the moment of trend confirmation for potential trade entries.
Indicator Features ✨
Clear Structure Display: By drawing connecting lines between valid HL and LH points, the indicator visually maps the current market structure.
Pivot Detection: It uses an effective method for Pivot detection, with the sensitivity adjustable via the "Pivot Left" and "Pivot Right" parameters.
Custom Label Placement (Crucial Detail):
HL Label: Placed below the candle for better visual clarity of the bullish support area.
LH Label: Placed above the candle for better visual clarity of the bearish resistance area.
Customizable Colors: Full control over the background and text colors for HL and LH signals, as well as the thickness and color of the connecting lines between Pivot points.
⚙️ Input Parameters
Pivot Settings
Pivot Left / Pivot Right: Determine the number of bars to the left and right that must have lower/higher prices for a point to be declared a valid Pivot (Pivot High or Pivot Low). Increase these values to detect more significant, longer-term swings.
Signal Colors
HL Background/Text Color: Colors for the background and text of the Higher Low (HL) labels.
LH Background/Text Color: Colors for the background and text of the Lower High (LH) labels.
Line Settings
Line Color / Line Width: Allows customization of the appearance of the line connecting the detected HL and LH points.
Recommended Use
This indicator is ideal for traders practicing Price Action and strategies based on Market Structure. Use the HL signals as potential zones for long entries (buying) in an uptrend, and LH signals as zones for short entries (selling) in a downtrend, always after the point formation is confirmed.

Divergence Strategy [Trendoscope®]🎲 Overview
The Divergence Strategy is a sophisticated TradingView strategy that enhances the Divergence Screener by adding automated trade signal generation, risk management, and trade visualization. It leverages the screener’s robust divergence detection to identify bullish, bearish, regular, and hidden divergences, then executes trades with precise entry, stop-loss, and take-profit levels. Designed for traders seeking automated trading solutions, this strategy offers customizable trade parameters and visual feedback to optimize performance across various markets and timeframes.
For core divergence detection features, including oscillator options, trend detection methods, zigzag pivot analysis, and visualization, refer to the Divergence Screener documentation. This description focuses on the strategy-specific enhancements for automated trading and risk management.
🎲 Strategy Features
🎯Automated Trade Signal Generation
Trade Direction Control : Restrict trades to long-only or short-only to align with market bias or strategy goals, preventing conflicting orders.
Divergence Type Selection : Choose to trade regular divergences (bullish/bearish), hidden divergences, or both, targeting reversals or trend continuations.
Entry Type Options :
Cautious : Enters conservatively at pivot points and exits quickly to minimize risk exposure.
Confident : Enters aggressively at the latest price and holds longer to capture larger moves.
Mixed : Combines conservative entries with delayed exits for a balanced approach.
Market vs. Stop Orders: Opt for market orders for instant execution or stop orders for precise price entry.
🎯 Enhanced Risk Management
Risk/Reward Ratio : Define a risk-reward ratio (default: 2.0) to set profit targets relative to stop-loss levels, ensuring consistent trade sizing.
Bracket Orders : Trades include entry, stop-loss, and take-profit levels calculated from divergence pivot points, tailored to the entry type and risk-reward settings.
Stop-Loss Placement : Stops are strategically set (e.g., at recent pivot or last price point) based on entry type, balancing risk and trade validity.
Order Cancellation : Optionally cancel pending orders when a divergence is broken (e.g., price moves past the pivot in the wrong direction), reducing invalid trades. This feature is toggleable for flexibility.
🎯 Trade Visualization
Target and Stop Boxes : Displays take-profit (lime) and stop-loss (orange) levels as boxes on the price chart, extending 10 bars forward for clear visibility.
Dynamic Trade Updates : Trade visualizations are added, updated, or removed as trades are executed, canceled, or invalidated, ensuring accurate feedback.
Overlay Integration : Trade levels overlay the price chart, complementing the screener’s oscillator-based divergence lines and labels.
🎯 Strategy Default Configuration
Capital and Sizing : Set initial capital (default: $1,000,000) and position size (default: 20% of equity) for realistic backtesting.
Pyramiding : Allows up to 4 concurrent trades, enabling multiple divergence-based entries in trending markets.
Commission and Margin : Accounts for commission (default: 0.01%) and margin (100% for long/short) to reflect trading costs.
Performance Optimization : Processes up to 5,000 bars dynamically, balancing historical analysis and real-time execution.
🎲 Inputs and Configuration
🎯Trade Settings
Direction : Select Long or Short (default: Long).
Divergence : Trade Regular, Hidden, or Both divergence types (default: Both).
Entry/Exit Type : Choose Cautious, Confident, or Mixed (default: Cautious).
Risk/Reward : Set the risk-reward ratio for profit targets (default: 2.0).
Use Market Order : Enable market orders for immediate entry (default: false, uses limit orders).
Cancel On Break : Cancel pending orders when divergence is broken (default: true).
🎯Inherited Settings
The strategy inherits all inputs from the Divergence Screener, including:
Oscillator Settings : Oscillator type (e.g., RSI, CCI), length, and external oscillator option.
Trend Settings : Trend detection method (Zigzag, MA Difference, External), MA type, and length.
Zigzag Settings : Zigzag length (fixed repaint = true).
🎲 Entry/Exit Types for Divergence Scenarios
The Divergence Strategy offers three Entry/Exit Type options—Cautious, Confident, and Mixed—which determine how trades are entered and exited based on divergence pivot points. This section explains how these settings apply to different divergence scenarios, with placeholders for screenshots to illustrate each case.
The divergence pattern forms after 3 pivots. The stop and entry levels are formed on one of these levels based on Entry/Exit types.
🎯Bullish Divergence (Reversal)
A bullish divergence occurs when price forms a lower low, but the oscillator forms a higher low, signaling a potential upward reversal.
💎 Cautious:
Entry : At the pivot high point for a conservative entry.
Exit : Stop-loss at the last pivot point (previous low that is higher than the current pivot low); take-profit at risk-reward ratio. Canceled if price breaks below the pivot (if Cancel On Break is enabled).
Behavior : Enters after confirmation and exits quickly to limit downside risk.
💎Confident:
Entry : At the last pivot low, (previous low which is higher than the current pivot low) for an aggressive entry.
Exit : Stop-loss at recent pivot low, which is the lowest point; take-profit at risk-reward ratio. Canceled if price breaks below the pivot. (lazy exit)
Behavior : Enters early to capture trend continuation, holding longer for gains.
💎Mixed:
Entry : At the pivot high point (conservative).
Exit : Stop-loss at the recent pivot point that has resulted in lower low (lazy exit). Canceled if price breaks below the pivot.
Behavior : Balances entry caution with extended holding for trend continuation.
🎯Bearish Divergence (Reversal)
A bearish divergence occurs when price forms a higher high, but the oscillator forms a lower high, indicating a potential downward reversal.
💎Cautious:
Entry : At the pivot low point (lower high) for a conservative short entry.
Exit : Stop-loss at the previous pivot high point (previous high); take-profit at risk-reward ratio. Canceled if price breaks above the pivot (if Cancel On Break is enabled).
Behavior : Enters conservatively and exits quickly to minimize risk.
💎Confident:
Entry : At the last price point (previous high) for an aggressive short entry.
Exit : Stop-loss at the pivot point; take-profit at risk-reward ratio. Canceled if price breaks above the pivot.
Behavior : Enters early to maximize trend continuation, holding longer.
💎Mixed:
Entry : At the previous piot high point (conservative).
Exit : Stop-loss at the last price point (delayed exit). Canceled if price breaks above the pivot.
Behavior : Combines conservative entry with extended holding for downtrend gains.
🎯Bullish Hidden Divergence (Continuation)
A bullish hidden divergence occurs when price forms a higher low, but the oscillator forms a lower low, suggesting uptrend continuation. In case of Hidden bullish divergence, b]Entry is always on the previous pivot high (unless it is a market order)
💎Cautious:
Exit : Stop-loss at the recent pivot low point (higher than previous pivot low); take-profit at risk-reward ratio. Canceled if price breaks below the pivot (if Cancel On Break is enabled).
Behavior : Enters after confirmation and exits quickly to limit downside risk.
💎Confident:
Exit : Stop-loss at previous pivot low, which is the lowest point; take-profit at risk-reward ratio. Canceled if price breaks below the pivot. (lazy exit)
Behavior : Enters early to capture trend continuation, holding longer for gains.
🎯Bearish Hidden Divergence (Continuation)
A bearish hidden divergence occurs when price forms a lower high, but the oscillator forms a higher high, suggesting downtrend continuation. In case of Hidden Bearish divergence, b]Entry is always on the previous pivot low (unless it is a market order)
💎Cautious:
Exit : Stop-loss at the latest pivot high point (which is a lower high); take-profit at risk-reward ratio. Canceled if price breaks above the pivot (if Cancel On Break is enabled).
Behavior : Enters conservatively and exits quickly to minimize risk.
💎Confident/Mixed:
Exit : Stop-loss at the previous pivot high point; take-profit at risk-reward ratio. Canceled if price breaks above the pivot.
Behavior : Uses the late exit point to hold longer.
🎲 Usage Instructions
🎯Add to Chart:
Add the Divergence Strategy to your TradingView chart.
The oscillator and divergence signals appear in a separate pane, with trade levels (target/stop boxes) overlaid on the price chart.
🎯Configure Settings:
Adjust trade settings (direction, divergence type, entry type, risk-reward, market orders, cancel on break).
Modify inherited Divergence Screener settings (oscillator, trend method, zigzag length) as needed.
Enable/disable alerts for divergence notifications.
🎯Interpret Signals:
Long Trades: Triggered on bullish or bullish hidden divergences (if allowed), shown with green/lime lines and labels.
Short Trades: Triggered on bearish or bearish hidden divergences (if allowed), shown with red/orange lines and labels.
Monitor lime (target) and orange (stop) boxes for trade levels.
Review strategy performance metrics (e.g., profit/loss, win rate) in the strategy tester.
🎯Backtest and Optimize:
Use TradingView’s strategy tester to evaluate performance on historical data.
Fine-tune risk-reward, entry type, position sizing, and cancellation settings to suit your market and timeframe.
For questions, suggestions, or support, contact Trendoscope via TradingView or official support channels. Stay tuned for updates and enhancements to the Divergence Strategy!

Fibonacci Retracement Engine (DFRE) [PhenLabs]📊 Fibonacci Retracement Engine (DFRE)
Version: PineScript™ v6
📌 Description
Dynamic Fibonacci Retracement Engine (DFRE) is a sophisticated technical analysis tool that automatically detects important swing points and draws precise Fibonacci retracement levels on various timeframes. The intelligent indicator eliminates the subjectivity of manual Fibonacci drawing using intelligent swing detection algorithms combined with multi timeframe confluence analysis.
Built for professional traders who demand accuracy and consistency, DFRE provides real time Fibonacci levels that adapt to modifications in market structure without sacrificing accuracy in changing market conditions. The indicator excels at identifying key support and resistance levels where price action is more likely to react, giving traders a potent edge in entry and exit timing.
🚀 Points of Innovation
Intelligent Swing Detection Algorithm : Advanced pivot detection with customizable confirmation bars and minimum swing percentage thresholds
Multi-Timeframe Confluence Engine : Simultaneous analysis across three timeframes to identify high-probability zones
Dynamic Level Management : Automatically updates and manages multiple Fibonacci sets while maintaining chart clarity
Adaptive Visualization System : Smart labeling that shows only the most relevant levels based on user preferences
Real-Time Confluence Detection : Identifies zones where multiple Fibonacci levels from different timeframes converge
Automated Alert System : Comprehensive notifications for level breakouts and confluence zone formations
🔧 Core Components
Swing Point Detection Engine : Uses pivot high/low calculations with strength confirmation to identify significant market turns
Fibonacci Calculator : Automatically computes standard retracement levels (0.236, 0.382, 0.5, 0.618, 0.786, 0.886) plus extensions (1.272, 1.618)
Multi-Timeframe Security Function : Safely retrieves Fibonacci data from higher timeframes without repainting
Confluence Analysis Module : Mathematically identifies zones where multiple levels cluster within specified thresholds
Dynamic Drawing Management : Efficiently handles line and label creation, updates, and deletion to maintain performance
🔥 Key Features
Customizable Swing Detection : Adjust swing length (3-50 bars) and strength confirmation (1-10 bars) to match your trading style
Selective Level Display : Choose which Fibonacci levels to show, from core levels to full extensions
Multi-Timeframe Analysis : Analyze up to 3 different timeframes simultaneously for confluence identification
Intelligent Labeling System : Options to show main levels only or all levels, with latest-set-only functionality
Visual Customization : Adjustable line width, colors, and extension options for optimal chart clarity
Performance Optimization : Limit maximum Fibonacci sets (1-5) to maintain smooth chart performance
Comprehensive Alerting : Get notified on level breakouts and confluence zone formations
🎨 Visualization
Dynamic Fibonacci Lines : Color-coded lines (green for uptrends, red for downtrends) with customizable width and extension
Smart Level Labels : Precise level identification with both ratio and price values displayed
Confluence Zone Highlighting : Visual emphasis on areas where multiple timeframe levels converge
Clean Chart Management : Automatic cleanup of old drawing objects to prevent chart clutter
Responsive Design : All visual elements adapt to different chart sizes and timeframes
📖 Usage Guidelines
Swing Detection Settings
Swing Detection Length - Default: 25 | Range: 3-50 | Controls the lookback period for identifying pivot points. Lower values detect more frequent swings but may include noise, while higher values focus on major market turns.
Swing Strength (Confirmation Bars) - Default: 2 | Range: 1-10 | Number of bars required to confirm a swing point. Higher values reduce false signals but increase lag.
Minimum Swing % Change - Default: 1.0% | Range: 0.1-10.0% | Minimum percentage change required to register a valid swing. Filters out insignificant price movements.
Fibonacci Level Settings
Individual Level Toggles : Enable/disable specific Fibonacci levels (0.236, 0.382, 0.5, 0.618, 0.786, 0.886)
Extensions : Show projection levels (1.272, 1.618) for target identification
Multi-Timeframe Settings
Timeframe Selection : Choose three higher timeframes for confluence analysis
Confluence Threshold : Percentage tolerance for level clustering (0.5-5.0%)
✅ Best Use Cases
Swing Trading : Identify optimal entry and exit points at key retracement levels
Confluence Trading : Focus on high-probability zones where multiple timeframe levels align
Support/Resistance Trading : Use dynamic levels that adapt to changing market structure
Breakout Trading : Monitor level breaks for momentum continuation signals
Target Setting : Utilize extension levels for profit target placement
⚠️ Limitations
Lagging Nature : Requires confirmed swing points, which means levels appear after significant moves
Market Condition Dependency : Works best in trending markets; less effective in extremely choppy conditions
Multiple Signal Complexity : Multiple timeframe analysis may produce conflicting signals requiring experience to interpret
Performance Considerations : Multiple Fibonacci sets and MTF analysis may impact indicator loading time on slower devices
💡 What Makes This Unique
Automated Precision : Eliminates manual drawing errors and subjective level placement
Multi-Timeframe Intelligence : Combines analysis from multiple timeframes for superior confluence detection
Adaptive Management : Automatically updates and manages multiple Fibonacci sets as market structure evolves
Professional-Grade Alerts : Comprehensive notification system for all significant level interactions
🔬 How It Works
Step 1 - Swing Point Identification : Scans price action using pivot high/low calculations with specified lookback periods, applies confirmation logic to eliminate false signals, and calculates swing strength based on surrounding price action for quality assessment.
Step 2 - Fibonacci Level Calculation : Automatically computes retracement and extension levels between confirmed swing points, creates dynamic level sets that update as new swing points are identified, and maintains multiple active Fibonacci sets for comprehensive market analysis.
Step 3 - Multi-Timeframe Confluence : Retrieves Fibonacci data from higher timeframes using secure request functions, analyzes level clustering across different timeframes within specified thresholds, and identifies high-probability zones where multiple levels converge.
💡 Note: This indicator works best when combined with other technical analysis tools and proper risk management. The multi-timeframe confluence feature provides the highest probability setups, but always confirm signals with additional analysis before entering trades.

Range Breakout [sgbpulse]Range Breakout
1. Overview
The "Range Breakout " indicator is a powerful tool designed to identify and visually display price ranges on your chart using pivot points. It dynamically draws two distinct boxes – an External Range and an Internal Range – helping traders pinpoint potential support and resistance zones. Beyond its visual representation, the indicator offers a comprehensive set of 12 unique breakout alerts, providing real-time notifications for significant price movements outside these defined ranges. Additionally, it integrates RSI and MFI metrics for momentum confirmation.
2. How It Works
The indicator operates by identifying pivot points based on user-defined "left" and "right" bar lengths. A high pivot is a bar with a specified number of lower highs both to its left and right, and similarly for a low pivot.
External Range: Calculated using longer pivot lengths (default: 15 bars left, 6 bars right). This range represents broader, more significant price consolidation areas.
Internal Range: Calculated using shorter pivot lengths (default: 4 bars left, 3 bars right). This range captures tighter, more immediate price consolidations within the broader trend.
The External Range will always be greater than or equal to the Internal Range, as it's based on a wider historical context. Both ranges are displayed as transparent boxes on your chart, dynamically adjusting as new pivots are formed.
3. Key Features and Settings
Customizable Pivot Lengths:
External Range (Left/Right Bars): Adjust sensitivity for identifying the broader price range. Longer lengths lead to more stable, but less frequent, range updates.
Internal Range (Left/Right Bars): Adjust sensitivity for the tighter, more immediate price range.
Tool Tips: Minimum 6 bars for the External Range, and minimum 2 bars for the Internal Range.
Customizable Range Colors: Easily change the background colors of the External and Internal Range boxes to match your chart's aesthetic.
Dynamic Range Display: The indicator automatically updates the range boxes as new pivot highs and lows are formed, always presenting the most current valid ranges.
RSI / MFI Settings:
Timeframe Source: Select the timeframe for RSI and MFI calculation.
- Chart: Calculation based on the current chart timeframe.
- Daily: Always calculated based on the daily ("D") timeframe, even if the chart is on a lower timeframe.
RSI Length: Period length for RSI calculation (default: 14).
RSI Overbought Level: Overbought level for RSI (default: 70.0).
RSI Oversold Level: Oversold level for RSI (default: 30.0).
MFI Length: Period length for MFI calculation (default: 14).
MFI Overbought Level: Overbought level for MFI (default: 80.0).
MFI Oversold Level: Oversold level for MFI (default: 20.0).
4. Synergy of Ranges & Breakout Strength
The interaction between the External and Internal Ranges provides deep insights into price movement and breakout strength:
Immediate Direction: The movement of the Internal Range (up or down) indicates the short-term directional bias within the broader framework of the External Range.
Strength Confirmation: A breakout of the External Range, followed by a breakout of the Internal Range, confirms the strength of the move and increases confidence in the breakout.
Strong Momentum ("Leaving" Ranges Behind): When price breaks out with exceptionally strong momentum, it continues to move aggressively and does not immediately form new pivots. In such situations, the existing ranges (External and Internal) remain in place while the candles "leave them behind." A "Full Candle" breakout, where the entire candle moves past both ranges, indicates a particularly powerful and decisive move.
Momentum (RSI / MFI) as Confirmation:
- RSI (Relative Strength Index): Measures the speed and change of price movements. Extreme values (above 70 or below 30) indicate overbought/oversold conditions respectively, confirming strong momentum in a breakout.
- MFI (Money Flow Index): Similar to RSI but incorporates volume. Extreme values (above 80 or below 20) indicate strong money flow in/out, reinforcing breakout confirmation.
- Importance of Confirmation: If a breakout occurs but momentum indicators do not confirm it (for example, an upside breakout while RSI is declining), this could signal weakness in the move and the risk of a false breakout (Fakeout).
5. Visuals
The indicator provides clear visual representations on the chart:
Range Boxes:
Two dynamic boxes are drawn on the chart: one for the External Range and one for the Internal Range.
These boxes update continuously, displaying the current range boundaries based on the latest pivots. They provide an immediate visual indication of support and resistance levels.
RSI/MFI Status Labels:
Small text labels appear to the right of the current bar, vertically centered.
They display the status of RSI and MFI: RSI OB (Overbought), RSI OS (Oversold), MFI OB, MFI OS, along with the exact value.
Important: The labels remain on the chart as long as the condition holds (indicator is above/below the level), unlike alerts which mark a singular crossover event.
Plotting of Key Values:
The indicator plots six invisible series on the chart, primarily to allow the user to view the exact numerical values of:
- The upper and lower bounds of the External Range (External High, External Low).
- The upper and lower bounds of the Internal Range (Internal High, Internal Low).
- The calculated RSI and MFI values (RSI, MFI).
These values are accessible for viewing through TradingView's Data Window and also via the Status Line when hovering over the relevant candle. This enables more precise quantitative analysis of range levels and momentum.
6. Comprehensive Breakout Alerts
The "Range Breakout " indicator provides 12 distinct alert conditions for breakouts, allowing you to select the required level of confirmation for each alert. All alerts are triggered only upon a fully confirmed bar close (barstate.isconfirmed) to minimize false signals and ensure reliability.
All breakout alerts are configured to detect a Crossover/Crossunder of the levels, meaning a specific event where the price moves from one side of the range to the other.
External Range Breakout UP
- Close: Price closes above the External Range.
- Real Body: The entire "real body" of the candle (min of open/close prices) closes above the External Range.
- Full Candle: The entire candle (the lowest point of the candle) closes above the External Range.
External Range Breakout DOWN
- Close: Price closes below the External Range.
- Real Body: The entire "real body" of the candle (max of open/close prices) closes below the External Range.
- Full Candle: The entire candle (the highest point of the candle) closes below the External Range.
Internal Range Breakout UP
- Close: Price closes above the Internal Range.
- Real Body: The "real body" of the candle closes above the Internal Range.
- Full Candle: The entire candle closes above the Internal Range.
Internal Range Breakout DOWN
- Close: Price closes below the Internal Range.
- Real Body: The "real body" of the candle closes below the Internal Range.
- Full Candle: The entire candle closes below the Internal Range.
7. Ideal Use Cases
This indicator is ideal for traders who:
Want to clearly identify and monitor price consolidation zones.
Seek confirmation for breakout strategies across various timeframes.
Require reliable and automated alerts for potential entry or exit points based on range expansion.
8. Complementary Indicator
For even more comprehensive market analysis, we highly recommend using this indicator in conjunction with Market Structure Support & Resistance External/Internal & BoS .
This powerful complementary indicator automatically and accurately identifies significant support and resistance levels by locating high and low pivot points, as well as key Pre-Market High/Low levels. Its strength lies in its dynamic adaptability to any timeframe and asset, providing precise and relevant real-time levels while maintaining a clean chart. It also identifies Break of Structure (BoS) to signal potential trend changes or continuations.
Using both indicators together provides a robust framework for identifying defined ranges and potential trend shifts, enabling more informed trading decisions.
View Market Structure Support & Resistance External/Internal & BoS Indicator
9. Important Note: Trading Risk
This indicator is intended for educational and informational purposes only and does not constitute investment advice or a recommendation for trading in any form whatsoever.
Trading in financial markets involves significant risk of capital loss. It is important to remember that past performance is not indicative of future results. All trading decisions are your sole responsibility. Never trade with money you cannot afford to lose.

Bull Bear Pivot by RawstocksThe "Bull Bear Pivot" indicator is a custom Pine Script (v5) tool designed for TradingView to assist traders in identifying key price levels and pivot points on intraday charts (up to 1-hour timeframes). It combines time-based open price markers, pivot high/low detection, and candlestick visualization to provide a comprehensive view of potential support, resistance, and trend reversal levels. Below is a detailed description of the indicator’s functionality, features, and intended use.
Indicator Overview:
The "Bull Bear Pivot" indicator is tailored for intraday trading, focusing on specific times of the day to mark significant price levels (open prices) and detect pivot points. It plots horizontal lines at the open prices of user-defined sessions, identifies pivot highs and lows on the current chart timeframe, and overlays custom candlesticks to highlight price action. The indicator is designed to work on timeframes of 1 hour or less (e.g., 1-minute, 3-minute, 5-minute, 15-minute, 30-minute, 60-minute) and includes a warning mechanism for invalid timeframes.
Key Features:
Time-Based Open Price Markers:
The indicator allows users to define up to five time-based sessions (e.g., 4:00 AM, 8:30 AM, 9:30 AM, 10:00 AM, and a custom time) to capture the open price at the start of each session.
For each session, it plots a horizontal line at the 1-minute open price, extending from the session start to the market close at 4:00 PM EST.
Each line is accompanied by a label positioned 5 bars to the right of the market close (4:00 PM EST), with the text right-aligned and vertically centered on the line.
Users can enable/disable each marker, customize the session time, label text, line color, and text color via the indicator’s settings.
Pivot Highs and Lows:
The indicator calculates pivot highs and lows on the current chart timeframe using the ta.pivothigh and ta.pivotlow functions.
Pivot highs are marked with green triangles above the bars, and pivot lows are marked with red triangles below the bars.
The pivot period (lookback/lookforward) is user-configurable, allowing flexibility in detecting short-term or longer-term reversals.
Custom Candlesticks:
The indicator overlays custom candlesticks on the chart, colored green for bullish candles (close > open) and red for bearish candles (close < open).
This feature helps visualize price action alongside the open price markers and pivot points.
Timeframe Restriction:
The indicator is designed to work on timeframes of 1 hour or less. If the chart timeframe exceeds 1 hour (e.g., 4-hour, daily), a warning label ("Timeframe > 1H\nIndicator Disabled") is displayed, and no elements are plotted.
Customizable Appearance:
Users can customize the appearance of the open price marker lines, including the line style (solid, dashed, dotted) and line width.
Labels for the open price markers have no background (transparent) and use customizable text colors.

Fractal levels Gold [AstroHub]This indicator detects key fractal points on a price chart and visually marks them with shapes and levels. It helps traders identify potential reversal zones and dynamic support/resistance levels, enhancing market analysis.
Key Features:
Fractal Detection:
The indicator identifies top and bottom fractals using a 5-bar pattern.
A top fractal forms when the middle bar has a higher high compared to the two bars on either side.
A bottom fractal forms when the middle bar has a lower low compared to the two bars on either side.
Fractal Filtering:
The indicator can filter out "pristine" fractals (uninterrupted fractal patterns) based on custom conditions, making it more selective and reducing false signals.
Fractal Plotting:
are plotted as downward triangles.
are plotted as upward triangles.
Users can choose to display or hide fractal points and their corresponding labels.
Fractal Levels:
The indicator automatically plots fractals' levels on the chart, marking potential resistance and support zones.
Fractal levels change dynamically as new fractals are identified.
Customizable Display Options:
Show or hide fractals and levels with adjustable settings.
Choose whether to apply filtering for pristine fractals.
Display the pivot labels to easily track fractal positions.
How It Works:
The indicator uses a simple approach to recognize top and bottom fractals . When a valid fractal is detected, it highlights it on the chart and plots the corresponding price level.
By default, top fractals are shown above the bars (red color), and bottom fractals are shown below the bars (green color).
Fractal levels represent potential reversal points and can act as dynamic support and resistance zones.
Best Use:
The indicator is particularly useful in identifying reversal points and trend changes, helping traders to spot key price levels.
It can be used across various timeframes and markets, particularly for trend-following or reversal strategies.
Customizable Settings:
Show Pivots: Toggle the display of pivot points.
Show Pivot Labels: Display labels for pivot levels.
Show Fractals: Toggle fractal points on the chart.
Show Fractal Levels: Show or hide the levels corresponding to the detected fractals.
Filter for Pristine Fractals: Enable this option to filter out non-pristine fractals for higher accuracy.
Conclusion:
This indicator provides clear, actionable fractal signals, helping traders easily identify critical levels for entry and exit. With customizable settings and visual cues, it's suitable for both novice and expe

Yakloft Support and Resistance LevelsYakloft Support and Resistance Levels Indicator
The Yakloft Support and Resistance Levels indicator is a powerful tool designed to help traders identify key support and resistance levels on a price chart. By leveraging advanced pivot point calculations and customizable settings, this indicator provides clear visual cues for potential price reversals and market trends.
Key Features
Automatic Support and Resistance Levels:
Dynamic Calculation: The indicator automatically identifies and plots significant support and resistance levels based on pivot highs and lows.
Customizable Strength: Adjust the S/R Strength parameter to filter levels according to their significance. Higher values display fewer but more robust levels.
Zones Around Levels:
Support and Resistance Zones: Create zones around each support and resistance level to highlight areas of interest rather than exact price points.
High/Low Zones: Plot zones around the highest and lowest price levels within a specified period, providing additional context for potential breakouts or reversals.
Zone Width Adjustment: Customize the width of the zones using the Zone Width % parameter, calculated as a percentage of the price range over the last 300 bars.
Line Styles and Fills:
Customizable Appearance: Modify line colors, styles (Solid, Dotted, Dashed), and widths to match your chart preferences.
Line Fills: Enhance visual clarity by filling zones with semi-transparent colors, making it easier to distinguish between support and resistance areas.
Dynamic Line Management:
Automatic Line Removal: To keep your chart uncluttered, the indicator removes a support or resistance line after the price crosses it twice. This feature helps you focus on the most relevant and current levels.
Expandable Lines:
Line Extension: Choose to extend lines both forward and backward in time with the Expand S/R Lines option, providing a comprehensive view of historical support and resistance.
How It Works
The indicator analyzes price data to identify pivot highs and lows over a specified lookback period. These pivot points are potential areas where the price may reverse or experience significant support or resistance. By filtering these points based on the S/R Strength parameter, the indicator ensures that only the most significant levels are displayed.
Once the levels are identified:
Support Levels: Plotted when the price shows potential to stop falling and possibly start rising.
Resistance Levels: Plotted when the price may stop rising and potentially start falling.
The indicator enhances these levels by:
Adding Zones: By creating a buffer around each level, traders can see areas where the price might interact with support or resistance, rather than focusing on a single price point.
Line Fills: The zones are filled with a semi-transparent color corresponding to support or resistance, improving visual distinction.
Input Parameters
Enable Support & Resistance: Toggle the entire indicator on or off.
Support Color: Choose the color for support lines and fills.
Resistance Color: Choose the color for resistance lines and fills.
S/R Strength: Set the sensitivity of level detection. Higher values result in fewer, more significant levels.
Line Style: Select the style of the support and resistance lines (Solid, Dotted, Dashed).
S/R Line Width: Adjust the thickness of the support and resistance lines.
Enable Zones: Toggle the display of zones around each level.
Enable High/Low Zones: Toggle the display of zones around the highest and lowest price levels.
Zone Width %: Define the width of the zones as a percentage of the price range over the last 300 bars.
Expand S/R Lines: Choose whether to extend the lines across the entire chart or limit them to recent data.
Using the Indicator
Identifying Key Levels:
Use the plotted support and resistance levels to identify potential entry and exit points.
Pay attention to the zones, as they represent areas where the price is more likely to react.
Monitoring Price Interaction:
Observe how the price behaves around the support and resistance levels.
The automatic removal of lines after two crossings helps focus on active levels.
Customizing for Clarity:
Adjust the visual settings to match your trading style and improve chart readability.
Experiment with the S/R Strength and Zone Width % to fine-tune the indicator to different market conditions.
Best Practices
Combine with Other Analysis Tools:
Use the indicator alongside other technical analysis tools like trend lines, moving averages, and oscillators for a more comprehensive market view.
Adjust for Different Timeframes:
The indicator works on various timeframes. Adjust the parameters when switching between short-term and long-term charts to maintain effectiveness.
Stay Updated with Market Conditions:
Market volatility can affect the significance of support and resistance levels. Regularly adjust the S/R Strength parameter to align with current market dynamics.
Limitations
Not a Standalone Solution:
While the indicator provides valuable insights, it should not be used in isolation. Always consider broader market analysis and risk management practices.
Historical Data Dependency:
The accuracy of the levels depends on the availability of sufficient historical data. Ensure your chart includes enough data for the indicator to perform effectively.

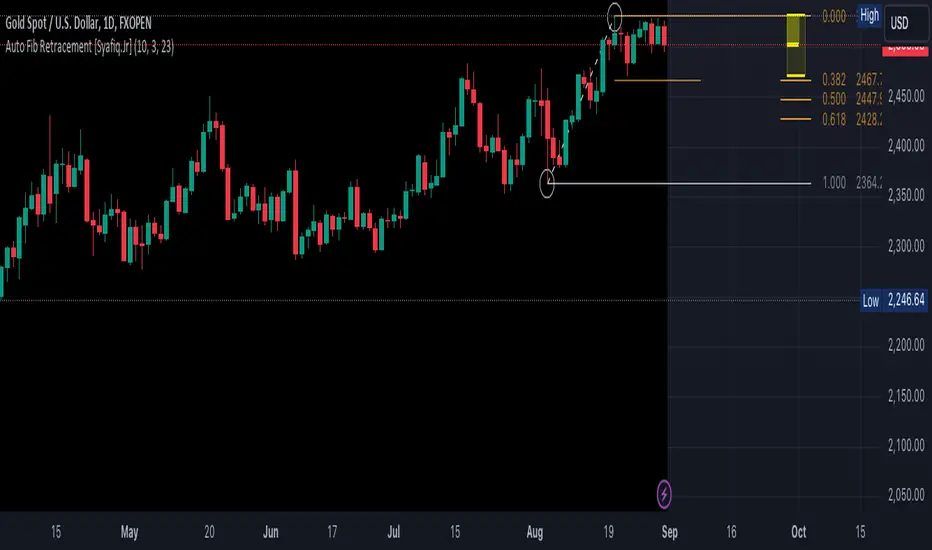
Auto Fib Retracement [Syafiq.Jr]This TradingView script is an advanced indicator titled "Auto Fib Retracement Neo ." It's designed to automatically plot Fibonacci retracement levels on a price chart, aiding in technical analysis for traders. Here's a breakdown of its functionality:
Core Functionality :
The script identifies pivot points (highs and lows) on a chart and draws Fibonacci retracement lines based on these points. The lines are dynamic, updating in real-time as the market progresses.
Customizable Inputs :
Depth: Determines the minimum number of bars considered in the pivot point calculation.
Deviation: Adjusts the sensitivity of the script in identifying new pivots.
Fibonacci Levels: Allows users to select which retracement levels (236, 382, 500, 618, 786, 886) are displayed on the chart.
Visual Settings: Customization options include the colors and styles of pivot points, trend lines, and the retracement meter.
Pivot and Line Calculation:
The script calculates the deviation between the current price and the last pivot point. If the deviation exceeds a certain threshold, it identifies a new pivot and draws a trend line between the previous pivot and the current one.
Visual Aids :
The indicator provides extensive visual aids, including pivot points marked with circles, dashed trend lines connecting pivots, and labels displaying additional information like price and delta rate.
Performance :
Optimized to handle large datasets, the script is configured to process up to 4000 bars and can manage numerous lines and labels efficiently.
Background and Appearance :
The script allows for customization of the chart background color, enhancing visibility based on user preferences.
In essence, this script is a powerful tool for traders who rely on Fibonacci retracement levels to identify potential support and resistance areas, allowing for a more automated and visually guided approach to market analysis.
Ultra Key LevelsThe "Ultra Key Levels" indicator is a powerful tool designed for traders who seek to identify critical price levels in the market. This Pine Script™ indicator is optimized to plot significant pivot highs and lows directly on your chart, providing a clear visual representation of potential support and resistance zones.
Pivot Detection: Automatically identifies and marks pivot highs and lows using customizable parameters. Traders can fine-tune the length of the pivots, allowing for precise detection of significant price points.
Dynamic Boxes: The indicator draws dynamic boxes around each identified pivot high and low, highlighting key levels. These boxes are adjusted based on the Average True Range (ATR), ensuring they reflect the current market volatility.
Pivot Highs/Lows: Control the appearance and behavior of pivot points with options to adjust source data, length, transparency, and the maximum number of pivots displayed on the chart.
ATR Multiplier: Set the ATR multiplier to determine the size of the boxes around pivot points, helping you assess the strength of each level.
Debug Mode: Activate debug mode to visualize pivot points and fine-tune your settings for optimal performance.
Scalability: Supports up to 500 boxes, making it suitable for both short-term and long-term traders who need to track multiple levels across different timeframes.
The "Ultra Key Levels" indicator is ideal for traders who rely on technical analysis to make informed decisions. By automatically identifying and highlighting key price levels, this tool helps you anticipate potential market movements and optimize your trading strategy.

[MT] Strategy Backtest Template| Initial Release | | EN |
An update of my old script, this script is designed so that it can be used as a template for all those traders who want to save time when programming their strategy and backtesting it, having functions already programmed that in normal development would take you more time to program, with this template you can simply add your favorite indicator and thus be able to take advantage of all the functions that this template has.
🔴Stop Loss and 🟢Take Profit:
No need to mention that it is a Stop Loss and a Take Profit, within these functions we find the options of: fixed percentage (%), fixed price ($), ATR, especially for Stop Loss we find the Pivot Points, in addition to this, the price range between the entry and the Stop Loss can be converted into a trailing stop loss, instead, especially for the Take Profit we have an option to choose a 1:X ratio that complements very well with the Pivot Points.
📈Heikin Ashi Based Entries:
Heikin Ashi entries are trades that are calculated based on Heikin Ashi candles but their price is executed to Japanese candles, thus avoiding false results that occur in Heikin candlestick charts, this making in certain cases better results in strategies that are executed with this option compared to Japanese candlesticks.
📊Dashboard:
A more visual and organized way to see the results and necessary data produced by our strategy, among them we can see the dates between which our operations are made regardless if you have activated some time filter, usual data such as Profit, Win Rate, Profit factor are also displayed in this panel, additionally data such as the total number of operations, how many were gains and how many losses, the average profit and loss for each operation and finally the maximum profits and losses followed, which are data that will be very useful to us when we elaborate our strategies.
Feel free to use this template to program your own strategies, if you find errors or want to request a new feature let me know in the comments or through my social networks found in my tradingview profile.
| Update 1.1 | | EN |
➕Additions: '
Time sessions filter and days of the week filter added to the time filter section.
Option to add leverage to the strategy.
5 Moving Averages, RSI, Stochastic RSI, ADX, and Parabolic Sar have been added as indicators for the strategy.
You can choose from the 6 available indicators the way to trade, entry alert or entry filter.
Added the option of ATR for Take Profit.
Ticker information and timeframe are now displayed on the dashboard.
Added display customization and color customization of indicator plots.
Added customization of display and color plots of trades displayed on chart.
📝Changes:
Now when activating the time filter it is optional to add a start or end date and time, being able to only add a start date or only an end date.
Operation plots have been changed from plot() to line creation with line.new().
Indicator plots can now be controlled from the "plots" section.
Acceptable and deniable range of profit, winrate and profit factor can now be chosen from the "plots" section to be displayed on the dashboard.
Aesthetic changes in the section separations within the settings section and within the code itself.
The function that made the indicators give inputs based on heikin ashi candles has been changed, see the code for more information.
⚙️Fixes:
Dashboard label now projects correctly on all timeframes including custom timeframes.
Removed unnecessary lines and variables to take up less code space.
All code in general has been optimized to avoid the use of variables, unnecessary lines and avoid unnecessary calculations, freeing up space to declare more variables and be able to use fewer lines of code.
| Lanzamiento Inicial | | ES |
Una actualización de mi antiguo script, este script está diseñado para que pueda ser usado como una plantilla para todos aquellos traders que quieran ahorrar tiempo al programar su estrategia y hacer un backtesting de ella, teniendo funciones ya programadas que en el desarrollo normal te tomaría más tiempo programar, con esta plantilla puedes simplemente agregar tu indicador favorito y así poder aprovechar todas las funciones que tiene esta plantilla.
🔴Stop Loss y 🟢Take Profit:
No hace falta mencionar que es un Stop Loss y un Take Profit, dentro de estas funciones encontramos las opciones de: porcentaje fijo (%), precio fijo ($), ATR, en especial para Stop Loss encontramos los Pivot Points, adicionalmente a esto, el rango de precio entre la entrada y el Stop Loss se puede convertir en un trailing stop loss, en cambio, especialmente para el Take Profit tenemos una opción para elegir un ratio 1:X que se complementa muy bien con los Pivot Points.
📈Entradas Basadas en Heikin Ashi:
Las entradas Heikin Ashi son operaciones que son calculados en base a las velas Heikin Ashi pero su precio esta ejecutado a velas japonesas, evitando así́ los falsos resultados que se producen en graficas de velas Heikin, esto haciendo que en ciertos casos se obtengan mejores resultados en las estrategias que son ejecutadas con esta opción en comparación con las velas japonesas.
📊Panel de Control:
Una manera más visual y organizada de ver los resultados y datos necesarios producidos por nuestra estrategia, entre ellos podemos ver las fechas entre las que se hacen nuestras operaciones independientemente si se tiene activado algún filtro de tiempo, datos usuales como el Profit, Win Rate, Profit factor también son mostrados en este panel, adicionalmente se agregaron datos como el número total de operaciones, cuantos fueron ganancias y cuantos perdidas, el promedio de ganancias y pérdidas por cada operación y por ultimo las máximas ganancias y pérdidas seguidas, que son datos que nos serán muy útiles al elaborar nuestras estrategias.
Siéntete libre de usar esta plantilla para programar tus propias estrategias, si encuentras errores o quieres solicitar una nueva función házmelo saber en los comentarios o a través de mis redes sociales que se encuentran en mi perfil de tradingview.
| Actualización 1.1 | | ES |
➕Añadidos:
Filtro de sesiones de tiempo y filtro de días de la semana agregados al apartado de filtro de tiempo.
Opción para agregar apalancamiento a la estrategia.
5 Moving Averages, RSI, Stochastic RSI, ADX, y Parabolic Sar se han agregado como indicadores para la estrategia.
Puedes escoger entre los 6 indicadores disponibles la forma de operar, alerta de entrada o filtro de entrada.
Añadido la opción de ATR para Take Profit.
La información del ticker y la temporalidad ahora se muestran en el dashboard.
Añadido personalización de visualización y color de los plots de indicadores.
Añadido personalización de visualización y color de los plots de operaciones mostradas en grafica.
📝Cambios:
Ahora al activar el filtro de tiempo es opcional añadir una fecha y hora de inicio o fin, pudiendo únicamente agregar una fecha de inicio o solamente una fecha de fin.
Los plots de operaciones han cambiados de plot() a creación de líneas con line.new().
Los plots de indicadores ahora se pueden controlar desde el apartado "plots".
Ahora se puede elegir el rango aceptable y negable de profit, winrate y profit factor desde el apartado "plots" para mostrarse en el dashboard.
Cambios estéticos en las separaciones de secciones dentro del apartado de configuraciones y dentro del propio código.
Se ha cambiado la función que hacía que los indicadores dieran entradas en base a velas heikin ashi, mire el código para más información.
⚙️Arreglos:
El dashboard label ahora se proyecta correctamente en todas las temporalidades incluyendo las temporalidades personalizadas.
Se han eliminado líneas y variables innecesarias para ocupar menos espacio en el código.
Se ha optimizado todo el código en general para evitar el uso de variables, líneas innecesarias y evitar los cálculos innecesarios, liberando espacio para declarar más variables y poder utilizar menos líneas de código.

Auto PitchFan, Fib Extension/Retracement and ZigZag by DGT Aᴜᴛᴏ PɪᴛᴄʜFᴀɴ, Fɪʙ Exᴛᴇɴꜱɪᴏɴ/Rᴇᴛʀᴀᴄᴇᴍᴇɴᴛ ᴀɴᴅ ZɪɢZᴀɢ
This study aim to automate PitchFan drawing tool and combines it with Fibonacci Extentions/Retracements and ZigZag.
Common setting options, applied to all components of the study
Deviation , is a multiplier that affects how much the price should deviate from the previous pivot in order for the bar to become a new pivot. Increasing its value is one way to get higher timeframe Levels
Depth , affects the minimum number of bars that will be taken into account when building
Historical PitchFan / Fibonacci Levels option will allow plotting of PitchFan / Fibonacci Levels on previous Pivot Highs/Lows
█ PɪᴛᴄʜFᴀɴ — is a set of rays spreading out of the point of a trend's beginning. These rays inclined with the coefficients formed by a Fibonacci number sequence. It is recommended to adjust the Pitchfan plottings to fit after the first wave of the trend has passed and the correction has clearly begun.
PitchFan rays corresponding to Fibonacci levels appear on a chart and represent inclined lines of support and resistance. Price areas near these rays are estimated areas from which the price can turn around or make a significant rebound. The whole logic of working with a pitchfan is based on one simple idea - if the price has bounced off the level, then the correction is likely to end, and the trend will continue. If the price has broken the first resistance, you should wait for the next level test
- Automatically plots PitchFan Rays, based on Pivot Lows/Highs.
- Ability to set ALERTs for each PitchFan Ray Level
- PitchFan Labels displays the price of the line at the last bar, the price value will be recalculated in each new bar
Please check the link provided below with the educational post of how to apply pitchfork, application of pitchfan is same keeping in mind the recommendation stated above
█ Fɪʙ Rᴇᴛʀᴀᴄᴇᴍᴇɴᴛs / Exᴛᴇɴꜱɪᴏɴꜱ
Fibonacci retracements is a popular instrument used by technical analysts to determine support and resistance areas. In technical analysis, this tool is created by taking two extreme points (usually a peak and a trough) on the chart and dividing the vertical distance by the key Fibonacci coefficients equal to 23.6%, 38.2%, 50%, 61.8%, and 100%.
Fibonacci extensions are a tool that traders can use to establish profit targets or estimate how far a price may travel AFTER a retracement/pullback is finished. Extension levels are also possible areas where the price may reverse.
IMPORTANT NOTE: Fibonacci extensions option may require to do further adjustment of the study parameters for proper usage. Extensions are aimed to be used when a trend is present and they aim to measure how far a price may travel AFTER a retracement/pullback. I will strongly suggest users of this study to check the education post for further details where to use extensions and where to use retracements
- Automatically plots possible Support and Resistance levels, based on Pivot Lows/Highs.
- Ability to set ALERTs for each Fibonacci Extension/Retracement Level
- Labels displays the level and the level price
█ Zɪɢ Zᴀɢ — The Zig Zag indicator is used to help identify price trends and changes in price trends. The Zig Zag indicator plots points on a chart whenever prices reverse by a percentage greater than a Deviation variable. Straight lines are then drawn, connecting these points. The Zig Zag indicator serves base for PitchFan and Fibonacci Retracements / Extensions
█ OTHER
PitchFan is often used in combination with the other indicators and/or drawing tools such as Fibonacci Retracement, Fibonacci Channels, Fibonacci Time Zone and others. It allows identify the most powerful areas from which price can turn and to get more accurate trading signal
Andrews’ Pitchfork, how to apply pitchfork and automated pitchfork study
Fibonacci Fans, how to apply fibonacci fans and automated fibonacci speed and resistance fans study
Fibonacci Extension / Retracement, where to use extensions and where to use retracements and automated fibonacci extension / retracement / pivot points study
Others
Fibonacci Channels, how to apply fibonacci channels and automated fibonacci channels study
Linear Regression Channels, , what linear regression channels are? and linear regression channel/curve/slope study
Disclaimer :
Trading success is all about following your trading strategy and the indicators should fit within your trading strategy, and not to be traded upon solely
The script is for informational and educational purposes only. Use of the script does not constitute professional and/or financial advice. You alone have the sole responsibility of evaluating the script output and risks associated with the use of the script. In exchange for using the script, you agree not to hold dgtrd TradingView user liable for any possible claim for damages arising from any decision you make based on use of the script

Precision Trendlines - Relevant Current TFPrecision Structural Trendlines (Current TF)
Overview
The Precision Structural Trendlines indicator is a high-performance price action tool designed for traders who rely on market structure and trend convergence. Unlike standard trendline scripts that clutter the chart with every possible connection, this indicator strictly follows professional structural rules—connecting Lower Highs for resistance and Higher Lows for support.
Key Features
Structural Integrity: The engine ensures that resistance lines are only drawn during bearish sequences (Lower Highs) and support lines during bullish sequences (Higher Lows), aligning with core Price Action principles.
Dynamic Relevance Filter: Solve the "web of lines" problem. By default, the script only shows trendlines that are currently relevant to price. As price moves away from old trends, they fade out, keeping your workspace clean.
Zero Drift Synchronization: Built using absolute time-anchoring (xloc.bar_time), ensuring that trendlines stay perfectly "glued" to the candle wicks regardless of how much you scroll or zoom.
Customizable Aesthetics: Choose between Random Dark Colors to easily distinguish overlapping trends or a Static Color for a unified look. Global width controls allow for instant visibility adjustments.
How to Use
Trend Confirmation: Use the Minimum Points setting. Set it to 2 for aggressive, early trend detection, or 3 to only see lines that have been validated by multiple touches.
Major vs. Minor Swings: Adjust the Pivot Strength. A value of 30 (default) captures significant intraday turns, while 20+ is ideal for identifying major swing structure.
Relevance Buffer: Tune the Price Buffer % to determine how close price must be to a historical trendline before it reappears on your chart.
Settings Breakdown
Minimum Points: Number of pivot points required to anchor a line.
Pivot Strength: The "look-left/look-right" requirement to confirm a peak or valley.
Validation Tolerance: The vertical buffer allowed for a 3rd point to "hit" the trendline.
Show Relevant Only: Toggles the visibility filter (highly recommended for high-volume traders).

Forever ModelForever Model is a comprehensive trading framework that visualizes market structure through Fair Value Gaps (FVGs), Smart Money Technique (SMT) divergences, and order block confirmations. The indicator identifies potential price rotations by tracking internal liquidity zones, correlation breaks between assets, and confirmation signals across multiple timeframes.
Designed for clarity and repeatability, the model presents a structured visual logic that supports manual analysis while maintaining flexibility across different assets and timeframes. All components are non-repainting, ensuring historical accuracy and reliable backtesting.
Description
The model operates through a three-part sequence that forms the visual foundation for identifying potential market rotations:
Fair Value Gaps (FVGs)
FVGs are price imbalances detected on higher timeframes—areas where price moved rapidly between candles, leaving an inefficiency that may be revisited. The indicator identifies both bullish and bearish FVGs, displaying them with color-coded levels that extend until mitigated.
: Chart showing FVG detection with colored lines indicating bullish (green) and bearish (red) gaps
Smart Money Technique (SMT)
SMT detects divergence between the current chart asset and a correlated pair. When one asset makes a higher high while the other forms a lower high (or vice versa), it indicates a potential shift in delivery. The indicator draws visual lines connecting these divergence points and can filter SMTs to only display those occurring within FVG ranges.
: Chart showing SMT divergence lines between two correlated assets with labels indicating the pair name]
Order Block Confirmations (OB)
When price confirms a signal by crossing a pivot level, an Order Block is created. The confirmation line extends from the pivot point, labeled as "OB+" for bullish signals or "OB-" for bearish signals. The latest OB extends to the current bar, while previous OBs remain fixed at their confirmation points.
: Chart showing OB confirmation lines with OB+ and OB- labels at confirmation points]
Key Features
Higher Timeframe (HTF) Detection
FVGs are detected on a higher timeframe than the current chart, with automatic HTF selection based on the current timeframe or manual override options. This ensures that internal liquidity zones are identified from the appropriate structural context.
External Range Liquidity (ERL)
Tracks the latest higher timeframe pivot highs and lows, marking external liquidity levels that may be revisited. ERL levels are displayed as horizontal lines with optional labels, providing context for potential continuation targets.
: Chart showing ERL lines at recent HTF pivot points
Signal Creation and Confirmation System
The model creates pending signals when FVG levels are mitigated. Signals confirm when price closes beyond a pivot level, creating the OB confirmation line. Stop levels are automatically calculated from the maximum (bearish) or minimum (bullish) price between signal creation and confirmation.
SMT Filtering Options
Display all SMTs or only those within FVG ranges
Require SMT for signal confirmation (optional filter)
Automatic or manual SMT pair selection
Support for both correlated and inverse correlated pairs
Directional Bias Filter
Filter FVG detection to show only bullish bias, bearish bias, or both. This allows analysts to align with higher timeframe structure or focus on unidirectional setups.
Confirmation Line Management
Toggle to extend only the latest confirmation line or all confirmation lines
Transparent label backgrounds with colored text (red for bearish, green for bullish)
Automatic cleanup of old confirmation lines (keeps last 50)
Labels positioned at line end (latest) or middle (older lines)
Position Sizing Calculator
Optional position sizing based on account balance, risk percentage or fixed amount, and instrument-specific contract sizes. Supports prop firm calculations and can display position size, entry, and stop levels in the dashboard.
Information Dashboard
A customizable floating table displays:
Current timeframe and HTF
Remaining time in current bar
Current bias direction
Latest confirmed signal details (type, size, entry, stop)
Pending signal status
The dashboard can be repositioned, resized, and styled to match your preferences.
Special Range Creation
When signals confirm, the model can automatically create special range levels from stop prices. These levels persist on the chart as important reference points, even after mitigation, serving as potential reversal zones for future signals.
Label and Visualization Controls
Toggle FVG labels on/off
Toggle confirmation lines on/off
Customizable colors for bullish and bearish FVGs
ERL color customization
SMT line width adjustment
Order Flow Integration (Optional)
The indicator includes optional Open Interest (OI) based special range detection, allowing integration with order flow analysis for enhanced context.
Technical Notes
All components are non-repainting—once formed, they remain on the chart
FVGs cannot be mitigated on their creation bar
Signal-based special ranges persist even after mitigation (important stop levels)
SMT detection supports both HTF and chart timeframe modes
Maximum 50 confirmation lines are maintained for performance
The model is designed to work across all asset classes and timeframes, providing a consistent framework for identifying potential market rotations through the interaction of internal liquidity, correlation breaks, and confirmation signals, this does not constitute as trading advice, past performance is no indication of future performance , this is entirely done for entertainment and educational purposes

RSI Dynamic Bands█ OVERVIEW
The "RSI Dynamic Bands" indicator is a variant of the Relative Strength Index (RSI) oscillator that brings its signals directly onto the price chart. It displays dynamic bands around the price, adjusted based on RSI levels, enabling easy identification of potential overbought or oversold conditions. The indicator also integrates a multi-timeframe RSI table, facilitating the analysis of trend strength across different timeframes.
█ CONCEPTS
The "RSI Dynamic Bands" indicator is designed to simplify the interpretation of price levels in the context of support and resistance zones, which can be correlated with other technical indicators and RSI values. Since the price itself does not display RSI values, a table showing RSI for four selected timeframes has been added, allowing traders to quickly assess trend strength across different time intervals. The most effective approach is to combine the indicator with other technical analysis tools, such as Fibonacci levels or pivot points, to confirm signals when the price approaches the bands and RSI values indicate a potential reversal.
Band Calculation
The bands are calculated based on the current closing price and RSI values, incorporating dynamic scaling to better adapt to market conditions. The formulas for the bands are as follows:
• Upper Band: close + (rsiUpper - rsi) * scaleFactor, where rsiUpper is the upper RSI level (default: 70), and scaleFactor accounts for market volatility.
• Lower Band: close + (rsiLower - rsi) * scaleFactor, where rsiLower is the lower RSI level (default: 30).
• Midline: The arithmetic average of the upper and lower bands: (upperBand + lowerBand) / 2.
Why Scaling? Without scaling, the bands would be chaotic and jagged, making them difficult to interpret. Scaling smooths the bands, making them wider during periods of high volatility and narrower during consolidation, better reflecting potential support and resistance levels.
Indicator Features
• Dynamic Price Bands: The bands adapt to market conditions, facilitating the identification of key price levels.
• Multi-Timeframe RSI Table: Displays RSI values for four selected timeframes (default: 15m, 1h, 4h, Daily), enabling comparison of trend strength across different perspectives.
• Style Customization: Users can adjust band colors, line thickness, and toggle the visibility of bands, fills, and the table.
How to Set Up the Indicator
1 — Add the "RSI Dynamic Bands" indicator to your TradingView chart.
2 — Configure parameters in the settings, such as RSI length, upper/lower levels, and scaling multiplier, to match your trading style.
3 — Enable or disable the display of bands, fills, or the RSI table based on your needs.
4 — Adjust band and table colors in the input section and line thickness in the "Style" section to better align the indicator with your chart.
█ OTHER SECTIONS
FEATURES
• RSI Length: The period for calculating RSI (default: 14).
• RSI Levels: Thresholds for overbought (default: 70) and oversold (default: 30).
• Scaling Multiplier: Adjusts bands based on market volatility (default: 0.15).
• Table Timeframes: Select four timeframes for the RSI table (default: 15m, 1h, 4h, Daily).
• Style Options: Customize band colors, fills, table, and line thickness.
HOW TO USE
Add the indicator to your chart, configure the parameters, and observe price interactions with the bands to identify potential entry and exit points. The RSI table allows you to compare RSI values across different timeframes, aiding in trading decisions. The most effective approach is to combine the indicator with other technical analysis tools, such as Fibonacci levels or pivot points, to confirm signals when the price approaches the bands and RSI values indicate a potential reversal.
Trading Strategies:
• Scalping: Use lower timeframes (e.g., 5m, 15m) in the RSI table to quickly identify short-term lows and highs. Wait for the price to approach the lower band in the RSI oversold zone, with RSI on lower timeframes starting to rise, and other tools, such as Fibonacci levels (e.g., 38.2%) or pivot points, confirming support.
• Medium-Term Trading: Focus on 1h and 4h timeframes. Look for confirmation of a low on a lower timeframe (e.g., 1h), where RSI indicates oversold conditions or starts rising, then check if RSI on a higher timeframe (e.g., 4h) confirms the trend. Confirmation from other tools, such as a Fibonacci level (e.g., 50%) or pivot point near the bands, strengthens the signal.
• Long-Term Trading: Use Daily and higher timeframes (e.g., Weekly). Wait for all relevant timeframes to confirm a low (e.g., RSI near oversold and price at the lower band), with lower timeframes (e.g., 4h) showing rising RSI. Other tools, such as Fibonacci levels (e.g., 61.8%) or pivot points near the bands, can further confirm a trend reversal signal.

Contrarian 100 MAPairs nicely with Enhanced-Stock-Ticker-with-50MA-vs-200MA located here:
Description
The Contrarian 100 MA is a sophisticated Pine Script v6 indicator designed for traders seeking to identify key market structure shifts and trend reversals using a combination of a 100-period Simple Moving Average (SMA) envelope and Inner Circle Trader (ICT) Break of Structure (BoS) and Market Structure Shift (MSS) logic. By overlaying a semi-transparent SMA-based shadow on the price chart and plotting bullish and bearish structure signals, this indicator helps traders visualize critical price levels and potential trend changes. It leverages higher timeframe (HTF) pivot points and dynamic logic to adapt to various chart timeframes, making it ideal for swing and contrarian trading strategies. Customizable colors, timeframes, and alert conditions enhance its versatility for manual and automated trading setups.
Key Features
SMA Envelope: Plots a 100-period SMA for high and low prices, creating a semi-transparent (50% opacity) purple shadow to highlight the price range and provide context for price movements.
ICT BoS/MSS Logic: Identifies Break of Structure (BoS) and Market Structure Shift (MSS) signals for both bullish and bearish conditions, based on HTF pivot points.
Dynamic Timeframe Support: Adjusts pivot detection based on user-selected HTF (default: 1D) and chart timeframe (1M, 5M, 15M, 30M, 1H, 4H, 1D), ensuring adaptability across markets.
Visual Signals: Draws dotted lines for BoS (bullish/bearish) and MSS (bullish/bearish) signals at pivot levels, with customizable colors for easy identification.
Contrarian Approach: Signals potential reversals by combining SMA context with ICT structure breaks, ideal for traders looking to capitalize on trend shifts.
Alert Conditions: Supports alerts for bullish/bearish BoS and MSS signals, enabling integration with TradingView’s alert system for automated trading.
Performance Optimization: Uses efficient pivot detection and line management to minimize resource usage while maintaining accuracy.
Technical Details
SMA Calculation:
Computes 100-period SMAs for high (smaHigh) and low (smaLow) prices.
Plots invisible SMAs (fully transparent) and fills the area between them with 50% transparent purple for visual context.
Pivot Detection:
Uses ta.pivothigh and ta.pivotlow to identify HTF swing points, with dynamic lookback periods (rlBars: 5 for daily, 2 for intraday).
Tracks pivot highs (pH, nPh) and lows (pL, nPl) using a custom piv type for price and time.
BoS/MSS Logic:
Bullish BoS: Triggered when price breaks above a pivot high in a bullish trend, drawing a line at the pivot level.
Bearish BoS: Triggered when price breaks below a pivot low in a bearish trend.
Bullish MSS: Occurs when price breaks a pivot high in a bearish trend, signaling a potential trend reversal.
Bearish MSS: Occurs when price breaks a pivot low in a bullish trend.
Lines are drawn using line.new with xloc.bar_time for precise alignment, styled as dotted with customizable colors.
HTF Integration: Fetches HTF close prices and pivot data using request.security with lookahead_on for accurate signal timing.
Line Management: Maintains an array of lines (lin), removing outdated lines when new MSS signals occur to keep the chart clean.
Pivot Reset: Clears broken pivots (e.g., when price exceeds a pivot high or falls below a pivot low) to ensure fresh signal generation.
How to Use
Add to Chart:
Copy the script into TradingView’s Pine Editor and apply it to your chart.
Configure Settings:
SMA Length: Adjust the SMA period (default: 100 bars) to suit your trading style.
Structure Timeframe: Set the HTF for pivot detection (default: 1D).
Chart Timeframe: Select the chart timeframe (1M, 5M, 15M, 30M, 1H, 4H, 1D) to adjust pivot sensitivity.
Colors: Customize bullish/bearish BoS and MSS line colors via input settings.
Interpret Signals:
Bullish BoS: White dotted line (default) at a broken pivot high in a bullish trend, indicating trend continuation.
Bearish BoS: White dotted line at a broken pivot low in a bearish trend.
Bullish MSS: White dotted line at a broken pivot high in a bearish trend, suggesting a reversal to bullish.
Bearish MSS: White dotted line at a broken pivot low in a bullish trend, suggesting a reversal to bearish.
Use the SMA shadow to gauge price position within the recent range.
Set Alerts:
Create alerts for bullish/bearish BoS and MSS signals using TradingView’s alert system.
Customize Visuals:
Adjust line colors or SMA fill transparency via TradingView’s settings for better visibility.
Example Use Cases
Swing Trading: Use MSS signals to enter trades at potential trend reversals, with the SMA envelope confirming price extremes.
Contrarian Trading: Capitalize on BoS and MSS signals to trade against prevailing trends, using the SMA shadow for context.
Automated Trading: Integrate BoS/MSS alerts with trading bots for systematic entries and exits.
Multi-Timeframe Analysis: Combine HTF signals (e.g., 1D) with lower timeframe charts (e.g., 1H) for precise entries.
Notes
Testing: Backtest the indicator on your chosen market and timeframe to validate performance.
Compatibility: Built for Pine Script v6 and tested on TradingView as of June 19, 2025.
Limitations: Signals rely on HTF pivot accuracy, which may lag in fast-moving markets. Adjust rlBars or timeframe for sensitivity.
Optional Enhancements: Consider uncommenting or adding a histogram for SMA divergence (e.g., smaHigh - smaLow) for additional insights.
Acknowledgments
This indicator combines ICT’s market structure concepts with a dynamic SMA envelope to provide a unique contrarian trading tool. Share your feedback or suggestions in the TradingView comments, and happy trading!

GIGANEVA V6.61 PublicThis enhanced Fibonacci script for TradingView is a powerful, all-in-one tool that calculates Fibonacci Levels, Fans, Time Pivots, and Golden Pivots on both logarithmic and linear scales. Its ability to compute time pivots via fan intersections and Range interactions, combined with user-friendly features like Bool Fib Right, sets it apart. The script maximizes TradingView’s plotting capabilities, making it a unique and versatile tool for technical analysis across various markets.
1. Overview of the Script
The script appears to be a custom technical analysis tool built for TradingView, improving upon an existing script from TradingView’s Community Scripts. It calculates and plots:
Fibonacci Levels: Standard retracement levels (e.g., 0.236, 0.382, 0.5, 0.618, etc.) based on a user-defined price range.
Fibonacci Fans: Trendlines drawn from a high or low point, radiating at Fibonacci ratios to project potential support/resistance zones.
Time Pivots: Points in time where significant price action is expected, determined by the intersection of Fibonacci Fans or their interaction with key price levels.
Golden Pivots: Specific time pivots calculated when the 0.5 Fibonacci Fan (on a logarithmic or linear scale) intersects with its counterpart.
The script supports both logarithmic and linear price scales, ensuring versatility across different charting preferences. It also includes a feature to extend Fibonacci Fans to the right, regardless of whether the user selects the top or bottom of the range first.
2. Key Components Explained
a) Fibonacci Levels and Fans from Top and Bottom of the "Range"
Fibonacci Levels: These are horizontal lines plotted at standard Fibonacci retracement ratios (e.g., 0.236, 0.382, 0.5, 0.618, etc.) based on a user-defined price range (the "Range"). The Range is typically the distance between a significant high (top) and low (bottom) on the chart.
Example: If the high is $100 and the low is $50, the 0.618 retracement level would be at $80.90 ($50 + 0.618 × $50).
Fibonacci Fans: These are diagonal lines drawn from either the top or bottom of the Range, radiating at Fibonacci ratios (e.g., 0.382, 0.5, 0.618). They project potential dynamic support or resistance zones as price evolves over time.
From Top: Fans drawn downward from the high of the Range.
From Bottom: Fans drawn upward from the low of the Range.
Log and Linear Scale:
Logarithmic Scale: Adjusts price intervals to account for percentage changes, which is useful for assets with large price ranges (e.g., cryptocurrencies or stocks with exponential growth). Fibonacci calculations on a log scale ensure ratios are proportional to percentage moves.
Linear Scale: Uses absolute price differences, suitable for assets with smaller, more stable price ranges.
The script’s ability to plot on both scales makes it adaptable to different markets and user preferences.
b) Time Pivots
Time pivots are points in time where significant price action (e.g., reversals, breakouts) is anticipated. The script calculates these in two ways:
Fans Crossing Each Other:
When two Fibonacci Fans (e.g., one from the top and one from the bottom) intersect, their crossing point represents a potential time pivot. This is because the intersection indicates a convergence of dynamic support/resistance zones, increasing the likelihood of a price reaction.
Example: A 0.618 fan from the top crosses a 0.382 fan from the bottom at a specific bar on the chart, marking that bar as a time pivot.
Fans Crossing Top and Bottom of the Range:
A fan line (e.g., 0.5 fan from the bottom) may intersect the top or bottom price level of the Range at a specific time. This intersection highlights a moment where the fan’s projected support/resistance aligns with a key price level, signaling a potential pivot.
Example: The 0.618 fan from the bottom reaches the top of the Range ($100) at bar 50, marking bar 50 as a time pivot.
c) Golden Pivots
Definition: Golden pivots are a special type of time pivot calculated when the 0.5 Fibonacci Fan on one scale (logarithmic or linear) intersects with the 0.5 fan on the opposite scale (or vice versa).
Significance: The 0.5 level is the midpoint of the Fibonacci sequence and often acts as a critical balance point in price action. When fans at this level cross, it suggests a high-probability moment for a price reversal or significant move.
Example: If the 0.5 fan on a logarithmic scale (drawn from the bottom) crosses the 0.5 fan on a linear scale (drawn from the top) at bar 100, this intersection is labeled a "Golden Pivot" due to its confluence of key Fibonacci levels.
d) Bool Fib Right
This is a user-configurable setting (a boolean input in the script) that extends Fibonacci Fans to the right side of the chart.
Functionality: When enabled, the fans project forward in time, regardless of whether the user selected the top or bottom of the Range first. This ensures consistency in visualization, as the direction of the Range selection (top-to-bottom or bottom-to-top) does not affect the fan’s extension.
Use Case: Traders can use this to project future support/resistance zones without worrying about how they defined the Range, improving usability.
3. Why Is This Code Unique?
Original calculation of Log levels were taken from zekicanozkanli code. Thank you for giving me great Foundation, later modified and applied to Fib fans. The script’s uniqueness stems from its comprehensive integration of Fibonacci-based tools and its optimization for TradingView’s plotting capabilities. Here’s a detailed breakdown:
All-in-One Fibonacci Tool:
Most Fibonacci scripts on TradingView focus on either retracement levels, extensions, or fans.
This script combines:
Fibonacci Levels: Static horizontal lines for retracement and extension.
Fibonacci Fans: Dynamic trendlines for projecting support/resistance.
Time Pivots: Temporal analysis based on fan intersections and Range interactions.
Golden Pivots: Specialized pivots based on 0.5 fan confluences.
By integrating these functions, the script provides a holistic Fibonacci analysis tool, reducing the need for multiple scripts.
Log and Linear Scale Support:
Many Fibonacci tools are designed for linear scales only, which can distort projections for assets with exponential price movements. By supporting both logarithmic and linear scales, the script caters to a wider range of markets (e.g., stocks, forex, crypto) and user preferences.
Time Pivot Calculations:
Calculating time pivots based on fan intersections and Range interactions is a novel feature. Most TradingView scripts focus on price-based Fibonacci levels, not temporal analysis. This adds a predictive element, helping traders anticipate when significant price action might occur.
Golden Pivot Innovation:
The concept of "Golden Pivots" (0.5 fan intersections across scales) is a unique addition. It leverages the symmetry of the 0.5 level and the differences between log and linear scales to identify high-probability pivot points.
Maximized Plot Capabilities:
TradingView imposes limits on the number of plots (lines, labels, etc.) a script can render. This script is coded to fully utilize these limits, ensuring that all Fibonacci levels, fans, pivots, and labels are plotted without exceeding TradingView’s constraints.
This optimization likely involves efficient use of arrays, loops, and conditional plotting to manage resources while delivering a rich visual output.
User-Friendly Features:
The Bool Fib Right option simplifies fan projection, making the tool intuitive even for users who may not consistently select the Range in the same order.
The script’s flexibility in handling top/bottom Range selection enhances usability.
4. Potential Use Cases
Trend Analysis: Traders can use Fibonacci Fans to identify dynamic support/resistance zones in trending markets.
Reversal Trading: Time pivots and Golden Pivots help pinpoint moments for potential price reversals.
Range Trading: Fibonacci Levels provide key price zones for trading within a defined range.
Cross-Market Application: Log/linear scale support makes the script suitable for stocks, forex, commodities, and cryptocurrencies.
The original code was from zekicanozkanli . Thank you for giving me great Foundation.

Auto Support Resistance Channels [TradingFinder] Top/Down Signal🔵 Introduction
In technical analysis, a price channel is one of the most widely used tools for identifying and tracking price trends. A price channel consists of two parallel trendlines, typically drawn from swing highs (resistance) and swing lows (support). These lines define dynamic support and resistance zones and provide a clear framework for interpreting price fluctuations.
Drawing a channel on a price chart allows the analyst to more precisely identify entry points, exit levels, take-profit zones, and stop-loss areas based on how the price behaves within the boundaries of the channel.
Price channels in technical analysis are generally categorized into three types: upward channels with a positive slope, downward channels with a negative slope, and horizontal (range-bound) channels with near-zero slope. Each type offers unique insights into market behavior depending on the price structure and prevailing trend.
Structurally, channels can be formed using either minor or major pivot points. A major channel typically reflects a stronger, more reliable structure that appears on higher timeframes, whereas a minor channel often captures short-term fluctuations or corrective movements within a larger trend.
For instance, a major downward channel may indicate sustained selling pressure across the market, while a minor upward channel could represent a temporary pullback within a broader bearish trend.
The validity of a price channel depends on several factors, including the number of price touches on the channel lines, the symmetry and parallelism of the trendlines, the duration of price movement within the channel, and price behavior around the median line.
When a price channel is broken, it is generally expected that the price will move in the breakout direction by at least the width of the channel. This makes price channels especially useful in breakout analysis.
In the following sections, we will explore the different types of price channels, how to draw them accurately, the structural differences between minor and major channels, and key trade interpretations when price interacts with channel boundaries.
Up Channel :
Down Channel :
🔵 How to Use
A price channel is a practical tool in technical analysis for identifying areas of support, resistance, trend direction, and potential breakout zones. The structure consists of two parallel trendlines within which price fluctuates.
Traders use the relative position of price within the channel to make informed trading decisions. The two primary strategies include range-based trades (buying low, selling high) and breakout trades (entering when price exits the channel).
🟣 Up Channel
In an upward channel, price moves within a positively sloped range. The lower trendline acts as dynamic support, while the upper trendline serves as dynamic resistance. A common strategy involves buying near the lower support and taking profit or selling near the upper resistance.
If price breaks below the lower trendline with strong volume or a decisive candle, it can signal a potential trend reversal. Channels constructed from major pivots generally reflect dominant uptrends, while those based on minor pivots are often corrective structures within a broader bearish movement.
🟣 Down Channel
In a downward channel, price moves between two negatively sloped lines. The upper trendline functions as resistance, and the lower trendline as support. Ideal entry for short trades occurs near the upper boundary, especially when confirmed by bearish price action or a resistance level.
Exit targets are typically located near the lower support. If the upper boundary is broken to the upside, it may be an early sign of a bullish trend reversal. Like upward channels, a major down channel represents broader selling pressure, while a minor one may indicate a brief retracement in a bullish move.
🟣 Range Channel
A horizontal or range-bound channel is characterized by price oscillating between two nearly flat lines. This type of channel typically appears during sideways markets or periods of consolidation.
Traders often buy near the lower boundary and sell near the upper boundary to take advantage of contained volatility. However, fake breakouts are more frequent in range-bound structures, so it is important to wait for confirmation through candlestick signals and volume. A confirmed breakout beyond the channel boundaries can justify entering a trade in the direction of the breakout.
🔵 Settings
Pivot Period :This parameter defines how sensitive the channel detection is. A higher value causes the algorithm to identify major pivot points, resulting in broader and longer-term channels. Lower values focus on minor pivots and create tighter, short-term channels.
🔔 Alerts
Alert Configuration :
Enable or disable the full alert system
Set a custom alert name
Choose the alert frequency: every time, once per bar, or on bar close
Define the time zone for alert timestamps (e.g., UTC)
Channel Alert Types :
Each channel type (Major/Minor, Internal/External, Up/Down) supports two alert types :
Break Alert : Triggered when price breaks above or below the channel boundaries
React Alert : Triggered when price touches and reacts (bounces) off the channel boundary
🎨 Display Settings
For each of the eight channel types, you can customize:
Visibility : show or hide the channel
Auto-delete previous channels when new ones are drawn
Style : line color, thickness, type (solid, dashed, dotted), extension (right only, both sides)
🔵 Conclusion
The price channel is a foundational structure in technical analysis that enables traders to analyze price movement, identify dynamic support and resistance zones, and locate potential entry and exit points with greater precision.
When constructed properly using minor or major pivots, a price channel offers a consistent and intuitive framework for interpreting market behavior—often simpler and more visually clear than many other technical tools.
Understanding the differences between upward, downward, and range-bound channels—as well as recognizing the distinctions between minor and major structures—is critical for selecting the right trading strategy. Upward channels tend to generate buying opportunities, downward channels prioritize short setups, and horizontal channels provide setups for both mean-reversion and breakout trades.
Ultimately, the reliability of a price channel depends on various factors such as the number of touchpoints, the duration of the channel, the parallelism of the lines, and how the price reacts to the median line.
By taking these factors into account, an experienced analyst can effectively use price channels as a powerful tool for trend forecasting and precise trade execution. Although conceptually simple, successful application of price channels requires practice, pattern recognition, and the ability to filter out market noise.

SuperTrend'ed Fibos - DolphinTradeBot
Overwiev
This indicator aims to assist in taking trades at relatively low price levels in the direction of the main trend and capturing profits at potential reversal points.
What is it for !
The indicator simply performs its calculations by using two multitimeframe SuperTrend indicators, Fibonacci levels, and pivot points. The reason for using MTF in both SuperTrend indicators is that the lengths of the levels are relatively limited, so it allows for a more detailed analysis on lower timeframes.
How is it work
When both the HTF SuperTrend and the main SuperTrend indicators are in the same direction,
For Uptrend:
Once the main SuperTrend line is violated it barcolor and draws the basic Fibonacci levels between the pivot high point and the SuperTrend line within the trend region . The TakeProfit level is drawn at a distance multiplied by the TakeProfit Multiplier, between the lowest and highest points of the level. When the main trend reverses or the TakeProfit level is violated, it stops drawing.
For Downtrend:
Once the main SuperTrend line is violated it barcolor and draws the basic Fibonacci levels between the pivot low point and the SuperTrend line within the trend region . The TakeProfit level is drawn at a distance multiplied by the TakeProfit Multiplier, between the lowest and highest points of the level. When the main trend reverses or the TakeProfit level is violated, it stops drawing.
How to Use:
To prevent the line thickness from being displayed on the screen, the indicator shows the direction of the HTF SuperTrend indicator by coloring the background. In the settings section, you can adjust:
TakeProfit Multiplier
Fibonacci line colors
HTF SuperTrend activation
HTF SuperTrend settings
Main SuperTrend settings
Fibonacci levels
Custom alert activation
Custom alert level
Alarm Section
By default, the indicator gives an alert when a level is formed or violated. Additionally, if you want to set an alert for a specific level, you can activate the Custom Alert option and choose your desired level.
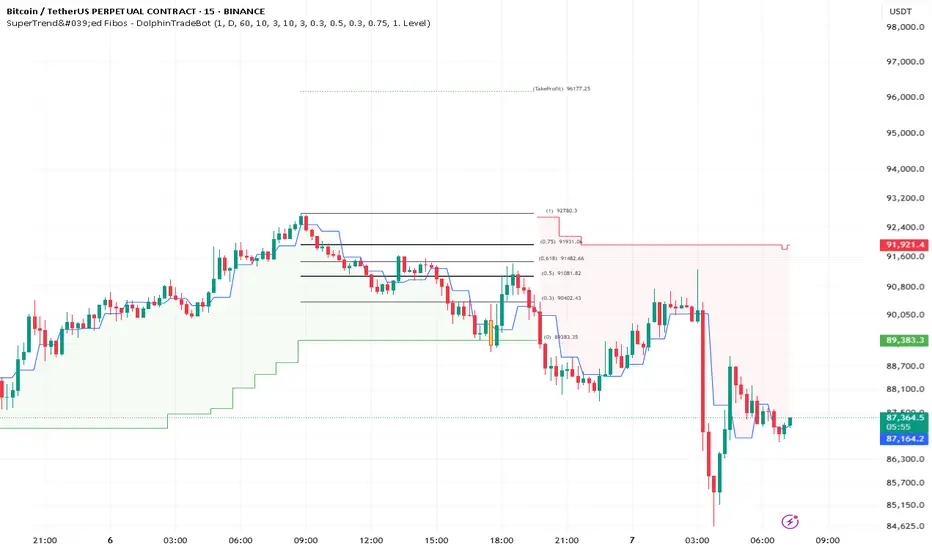
Multi Timeframe Candle/Retracement (MTCR)This script provides a visual representation of candlestick and pivot point information from higher timeframes within a lower timeframe chart. It is ideal for traders looking to analyze price movements and identify potential support and resistance zones in the context of a broader timeframe.
Key Features :
Multi-Timeframe Candlestick Visualization:
Displays candlesticks of the selected higher timeframe.
Highlights bullish and bearish candles with distinct colors to identify trends.
Pivot Point Analysis:
Calculates and visualizes pivot points based on the standard or Fibonacci model.
Supports customizable step sizes (rounding pivot values).
Highlights resistance levels (R1, R2, R3), support zones (S1, S2, S3), and a central base line.
Medians and High/Low Zones:
Visualizes median lines between pivot levels.
Optionally displays high and low zones.
Dynamic Updates:
Automatically updates lines and boxes with new candles or pivot calculations.
Visually marks when the current price touches key levels.
Settings :
Timeframe Selection:
Choose a higher timeframe for candlestick and pivot point visualization.
Customizable Colors:
Adjust colors for bullish and bearish candles, as well as for pivot point zones.
Flexible Display Options:
Display only the desired elements, such as pivot lines, median lines, high/low zones, or the base line.
Use Cases :
Identify key support and resistance zones using pivot points.
Analyze price movements on higher timeframes while trading on lower ones.
Utilize median lines to find potential reversal zones or areas for risk/reward analysis.
Notes :
This script is designed for advanced users with a solid understanding of multi-timeframe analysis and pivot points.
It uses multiple drawing objects (lines, boxes), so ensure your chart does not hit its drawing object limit.
Good luck with your trading! 🚀
